
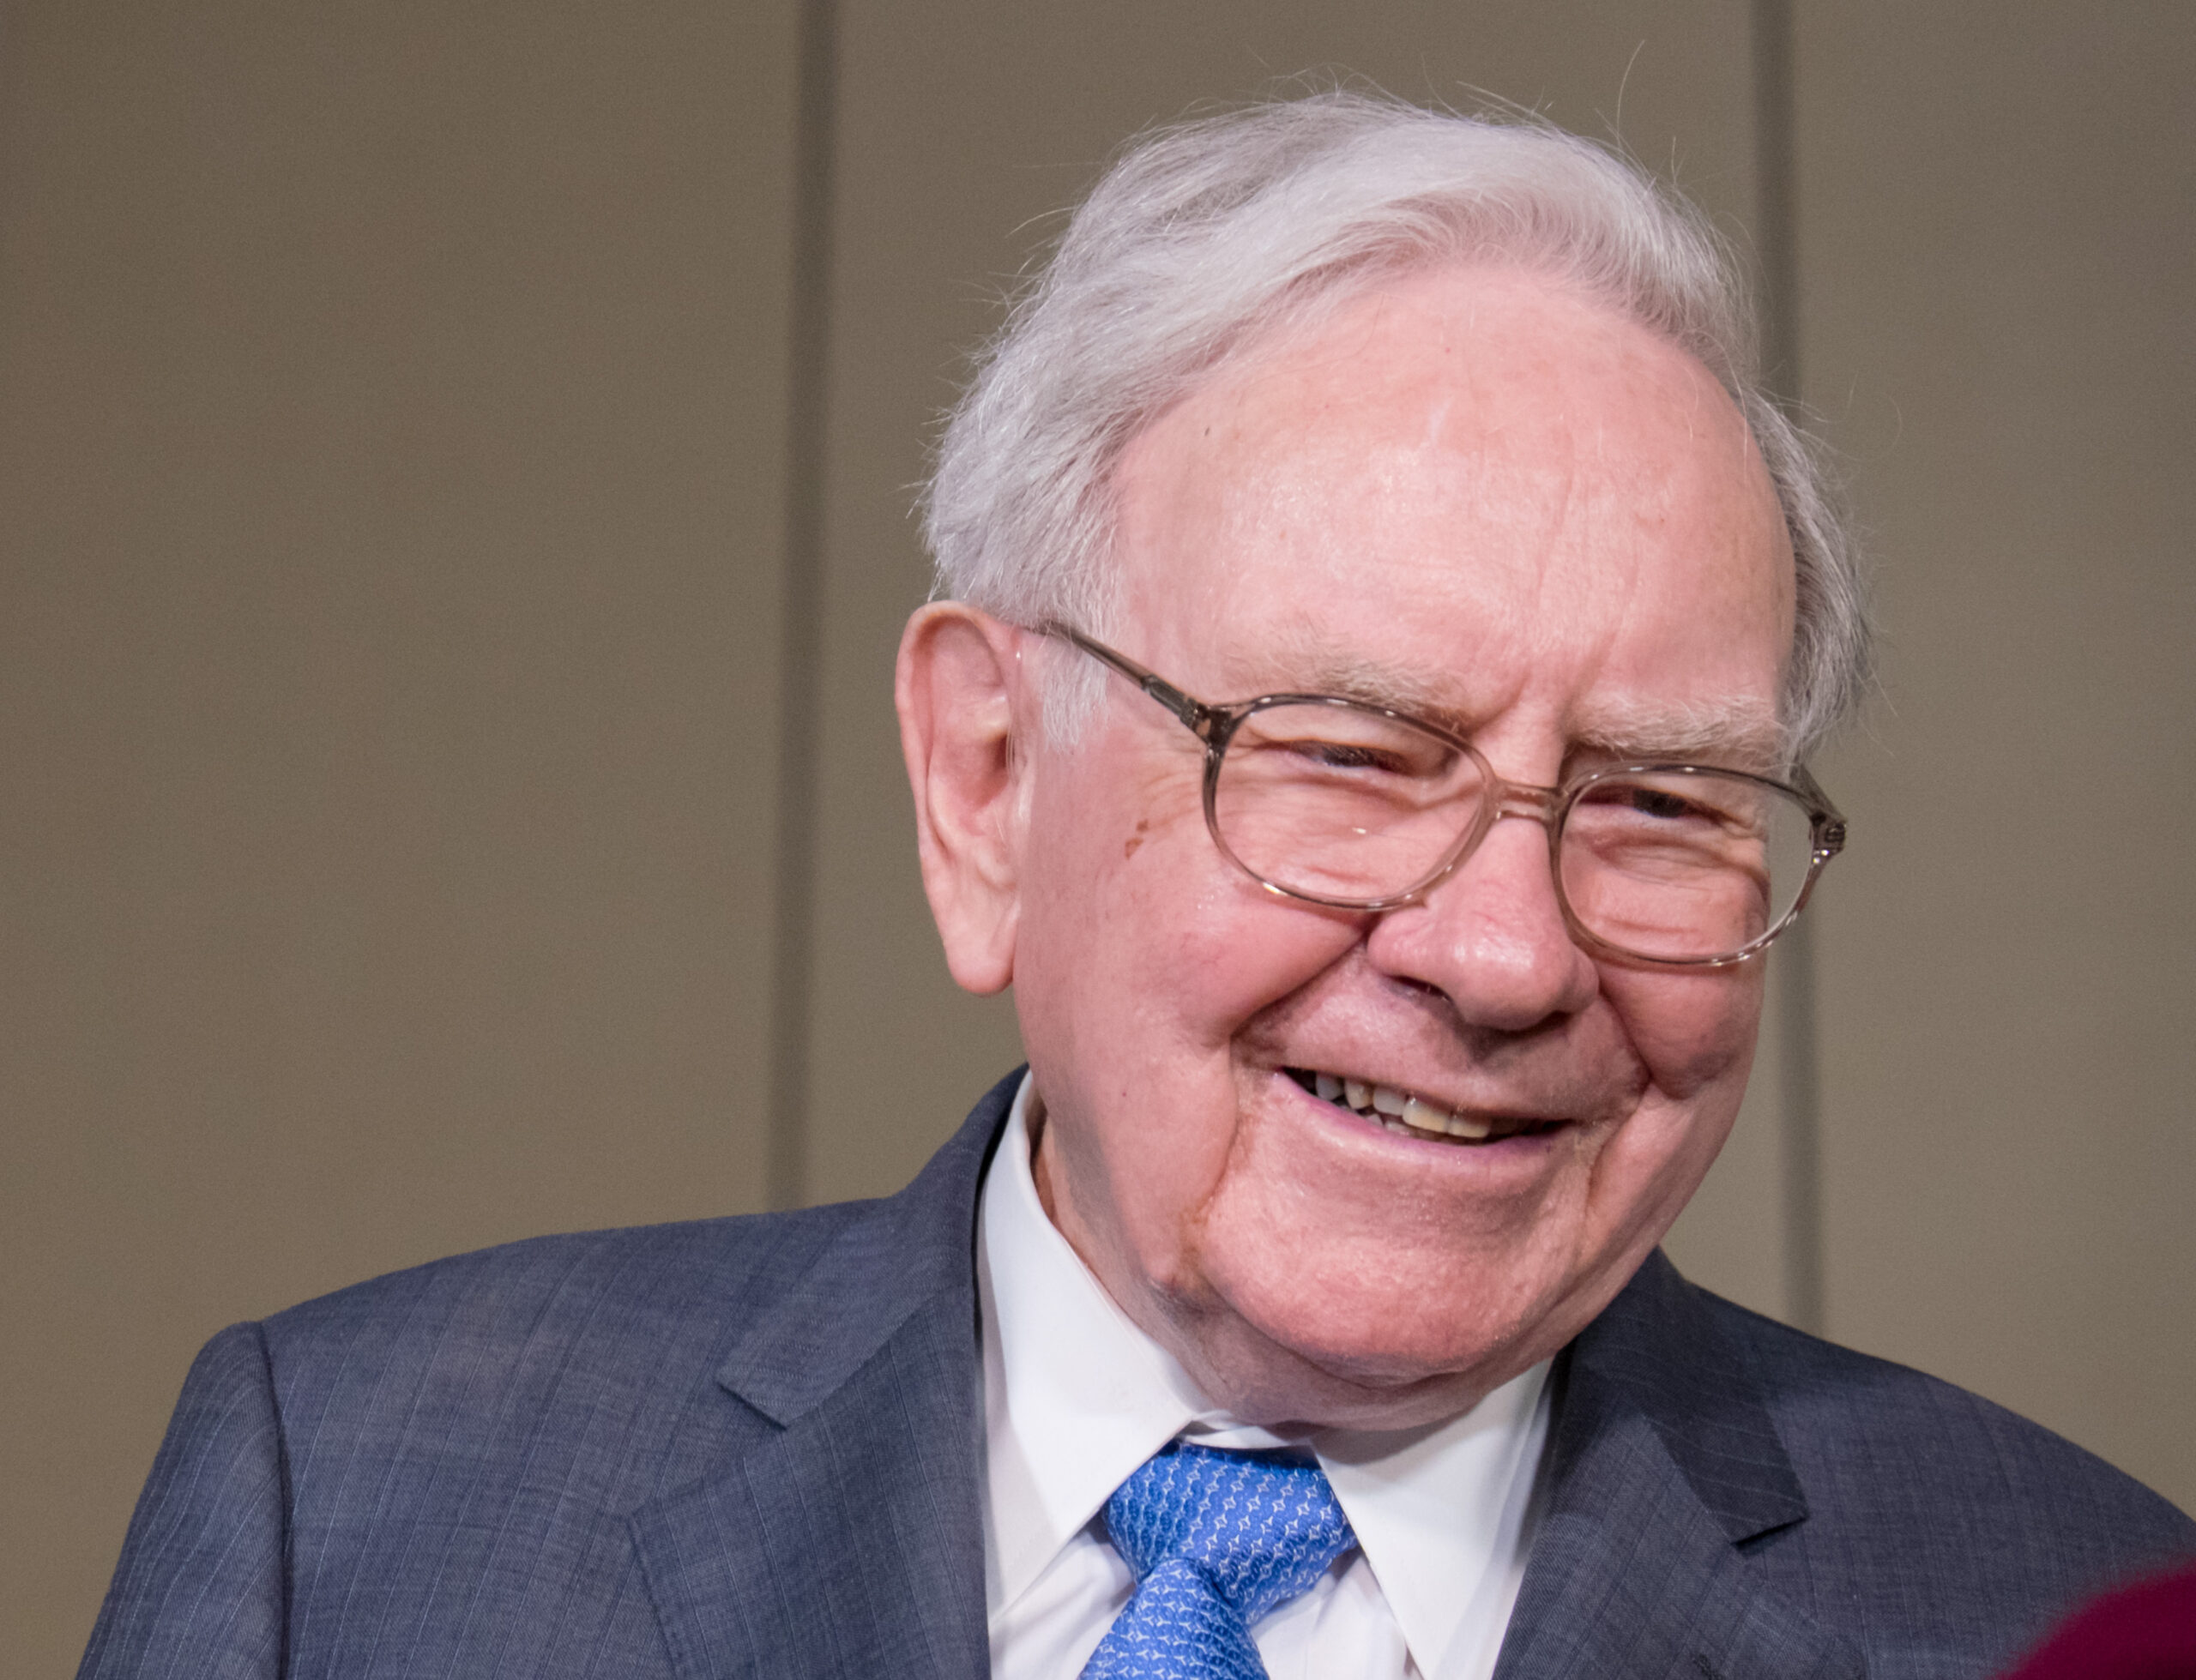
The market’s stress test just blinked red
The Warren Buffett indicator — market cap as a share of GDP — has climbed to an all-time high of 236%. Translation: the stock market is looking extra pricey relative to the size of the U.S. economy, like a house showing up on Zillow with a “price upon request” tag and a suspiciously fancy bathroom.
Why investors keep staring at it
This metric isn’t perfect, but it’s become one of those big-picture warning lights people love to argue about on TV. When it’s running hot, it usually tells you two things at once:
- Stocks are expensive compared with the real economy underneath them
- Investors are betting big on future growth, margins, and maybe a little magic
That doesn’t mean a crash is around the corner. Markets can stay expensive longer than your patience can. But it does mean expectations are high, and high expectations are where drama lives.
So… should you panic?
Not exactly. This is more of a “keep your seatbelt on” indicator than a crystal ball. For long-term investors, the bigger takeaway is that future returns may have to work harder from here unless earnings growth catches up in a hurry.
Big picture: when the Buffett indicator is this stretched, the market isn’t cheap — it’s basically wearing designer jeans and pretending they were on sale.